Bringing Complex Models to Life with Sankey Diagrams
One of the key areas of work for the Foreseer group is the development of a mathematical model that demonstrates just how interdependent and connected resources are. For example, land could be used to grow biofuels to generate energy, but this uses water which may in turn need to be desalinated (requiring energy) or may be diverted from irrigating food crops. Altering the balance of many different parameters, from population growth to the efficiency of solar panels, can lead to unexpected results in the future, when a particular resource hits the limit. This simplified example shows how many resources are connected together:
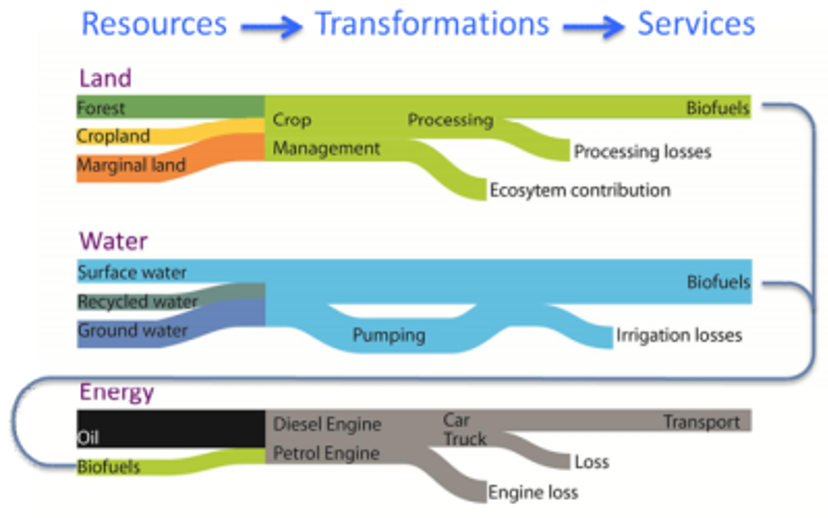
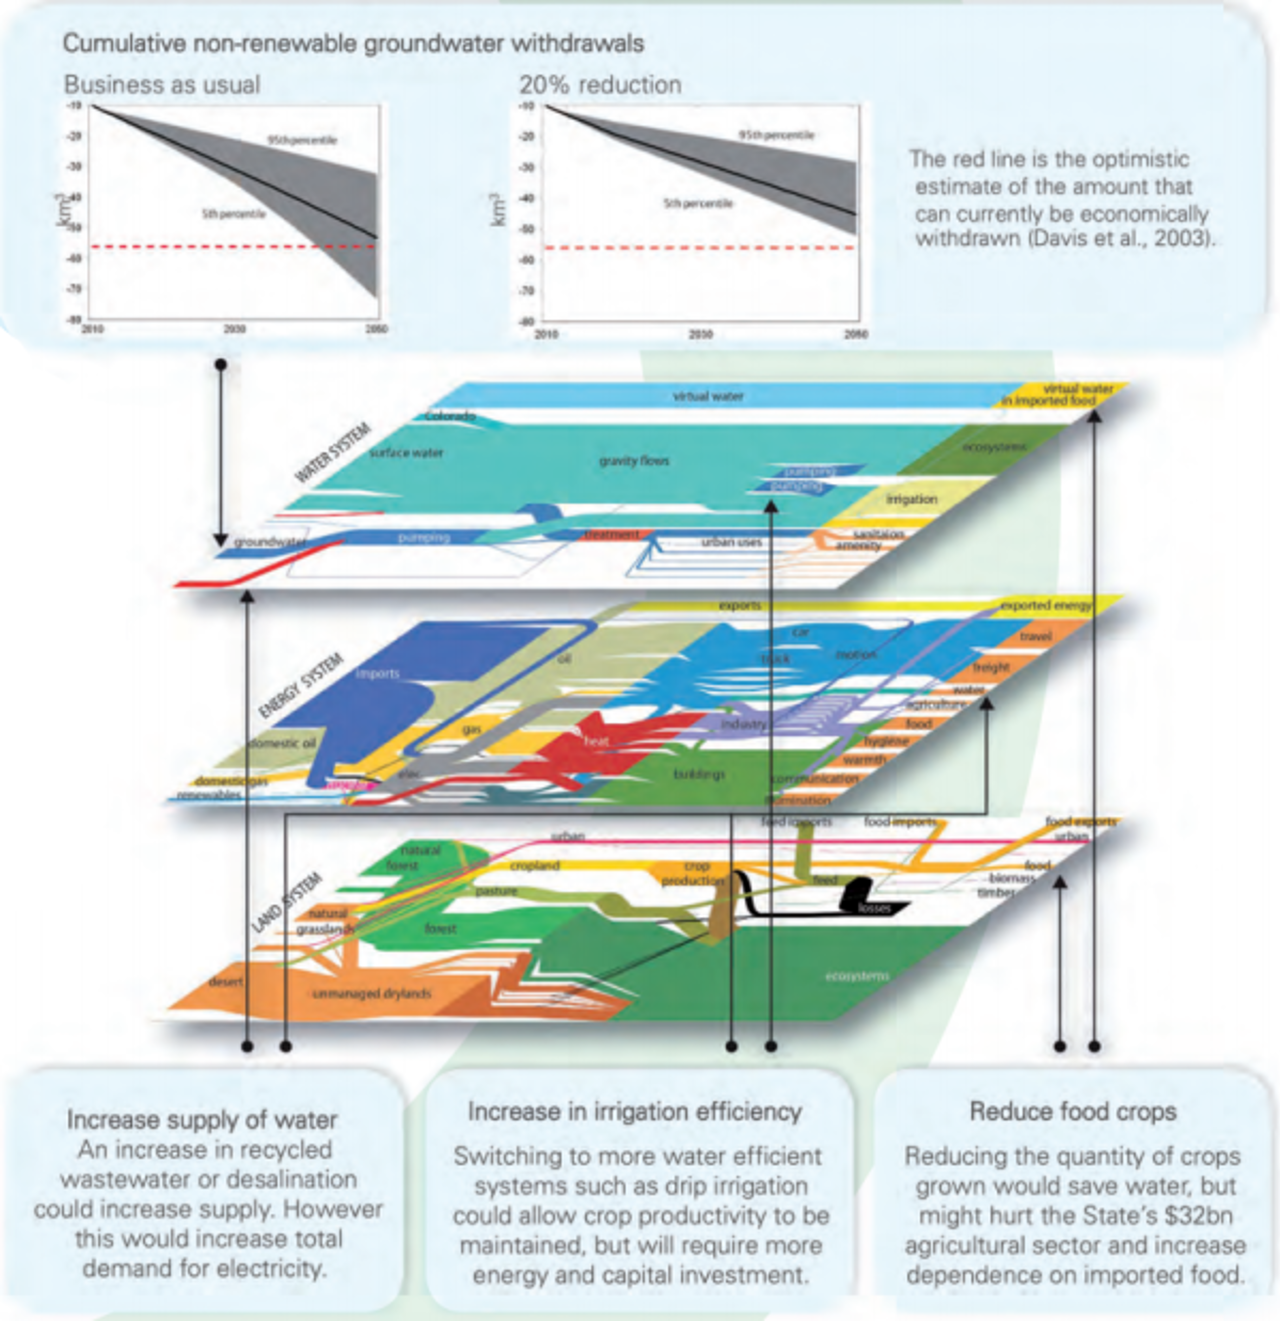
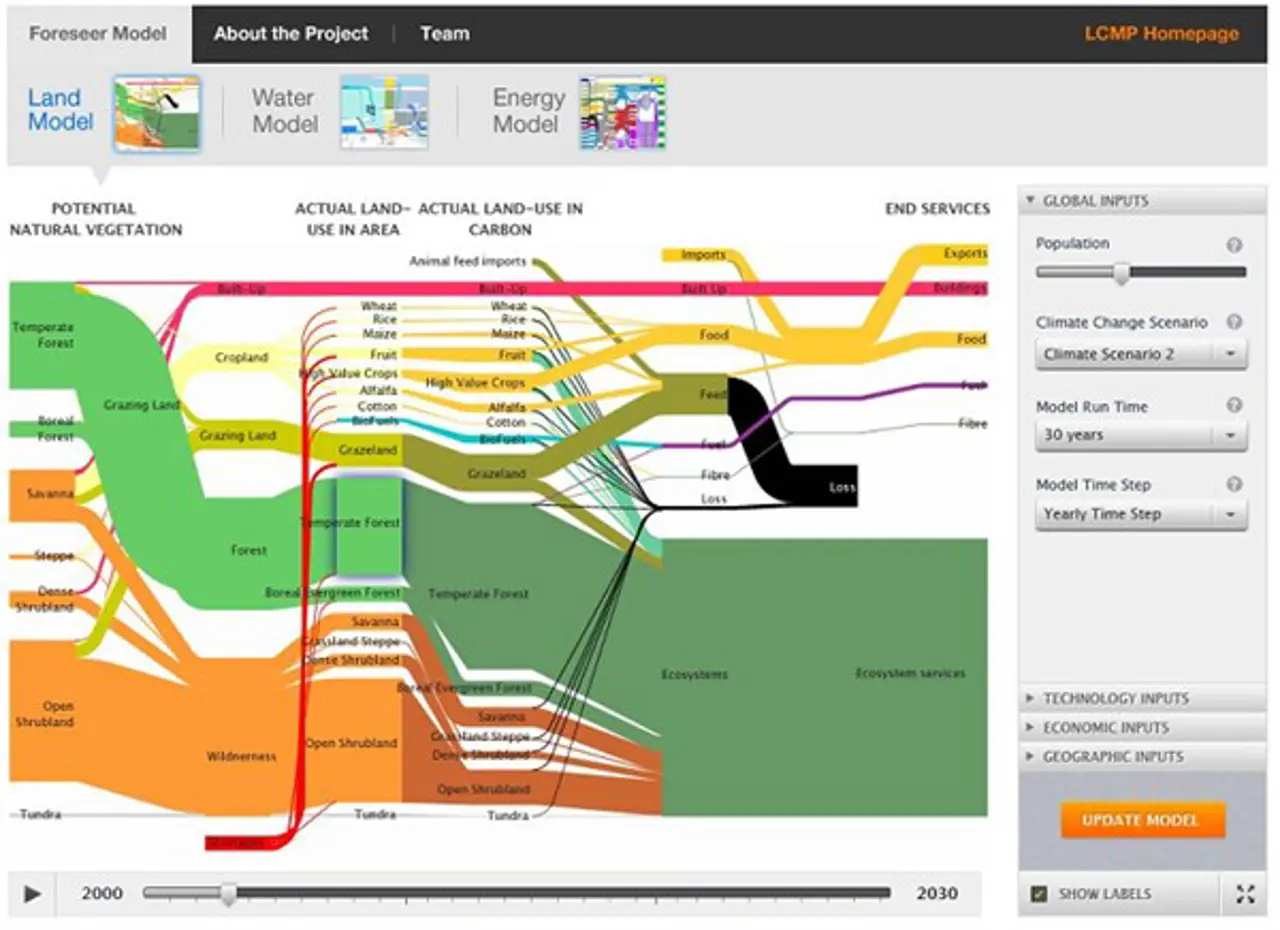
The full model is a wonderfully complex thing, but to be of any use as a research tool it requires a visual representation that is simple enough to grasp, but accurate enough to be useful. It also needs to be interactive to encourage exploration of future possibilities. The Foreseer team developed a Sankey diagram to illustrate how resources are used in different forms. For example, Foreseer can be used to track changes in groundwater stocks in California, allowing for uncertainty about rainfall. Increases in population and wealth will lead to increased extraction of groundwater, and may exhaust known reserves within the next century.
These static pictures were not enough – it needed to get connected. Fluent were asked to bring the visualisation to the web. We needed to develop a new datastructure for flexibly describing the information produced by the model, and then a means of rendering the diagrams – in a relatively new form.
We developed an XML schema to describe the information as a directed weighted graph of nodes; we did the geometry to ensure that the rendered curves remained constant width as they snake in and out of each other; we separated presentation information so that colour schemes, labels and routing suggestions were abstracted away from the model; we developed a standard for passing parameters and dependencies between independent federated versions of the model; oh, and we built a website and Silverlight plugin that makes it work on the web.
For further information about the Foreseer project, please read the official University of Cambridge press release about the Foreseer research.
Ready to solve your problems?
We'll help meet the challenges facing your growing business. Get in touch and tell us what you need, the team can't wait to hear from you.
Contact us
![2295X1200 Social Media [ All ] 01](https://fluent-umbraco-hwduaufvc9h8gbad.uksouth-01.azurewebsites.net/media/scujluzj/2295x1200-social-media-all-01.jpg?width=3840&height=2160&quality=70&format=Webp)