
The Royal Veterinary College (RVC) is the largest and longest-established vet school of its kind. It provides support for veterinary professionals through its network of referral hospitals and produces world-class research.
One such piece of research calculates the economic impact and efficacy of a disease control programme based on the selective slaughter of animals.
Their model works out the compensation values of diseased livestock based on a number of different inputs such as milk production, fertility and disease prevalence.
RVC came to Fluent with their calculation model in a spreadsheet. They wanted us to turn it into a more accessible format to help engage government policy makers with the research.
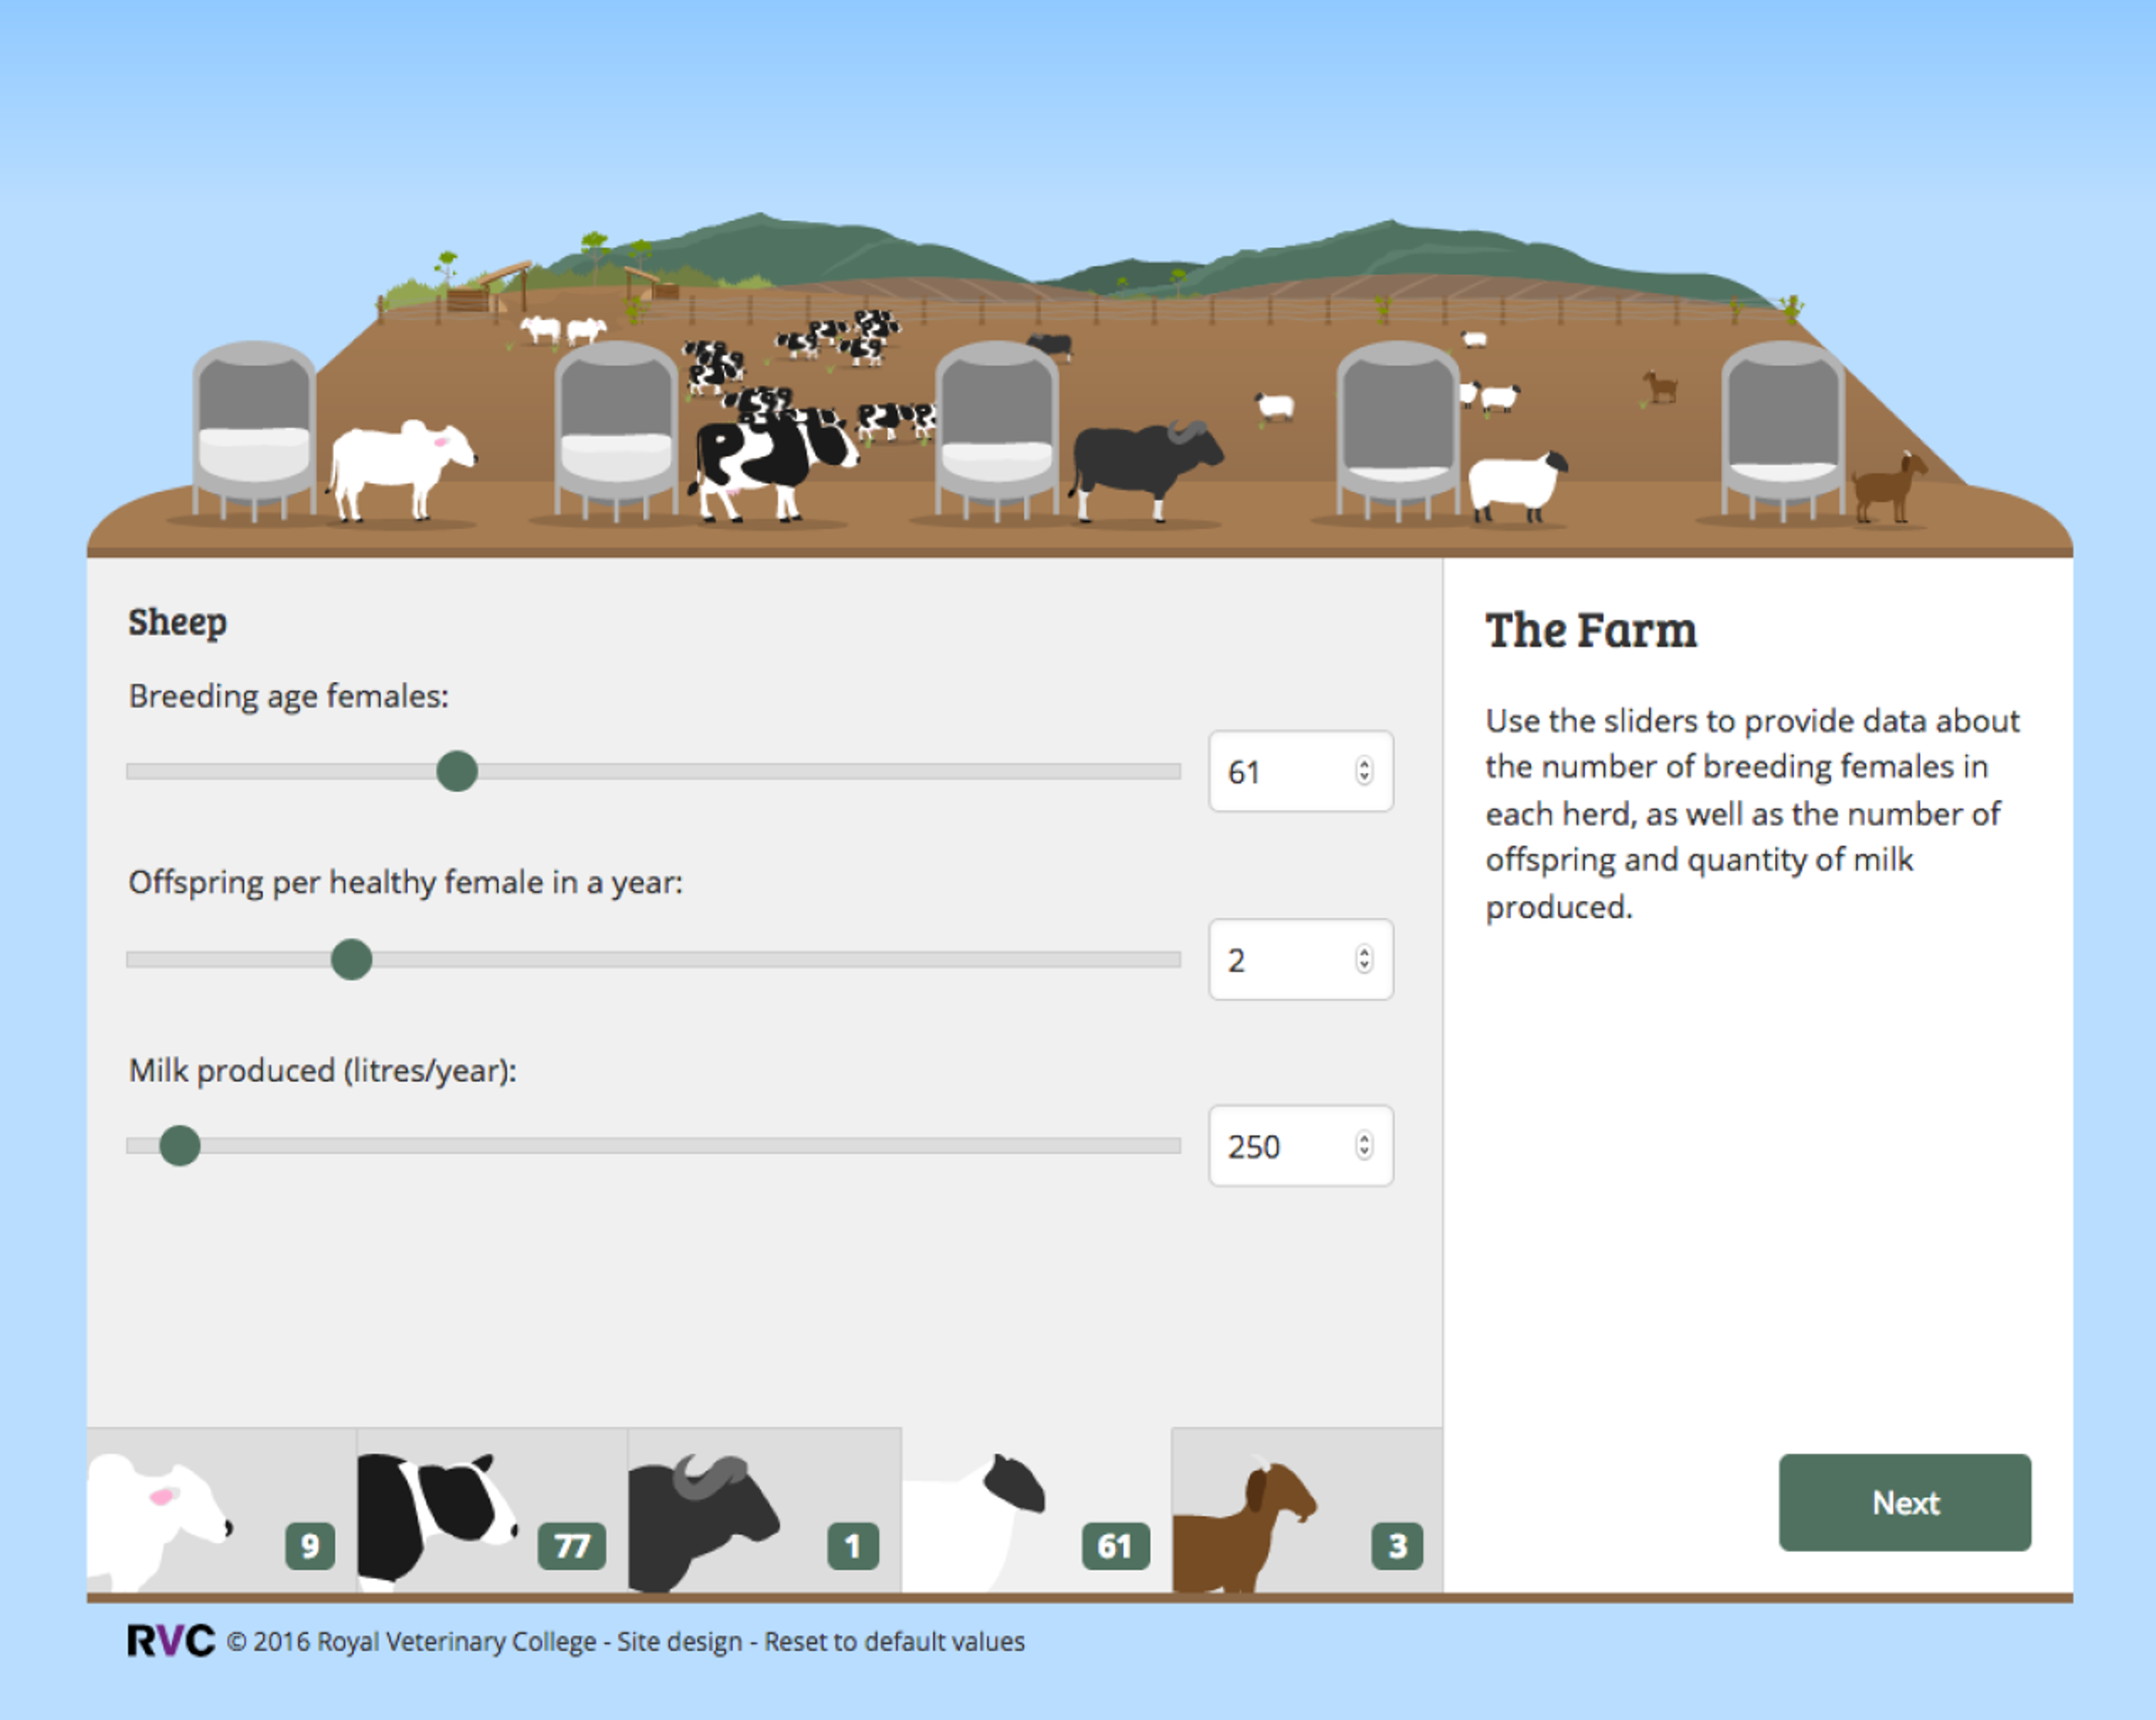
The calculation process was complex and the number of inputs quite large. So we came up with an interactive tool that broke the calculations down into 4 smaller, animated steps - each of which focuses on one area of data:
- Step 1 - “The Farm” - livestock numbers, breeding and milk production levels.
- Step 2 - “Prices” - livestock and milk costs.
- Step 3 - “Disease” - infection rates and the effect of the disease on production and fertility.
- Step 4 - “Test and slaughter” - the efficacy of the slaughter process on the disease and the sensitivity and specificity of the test.
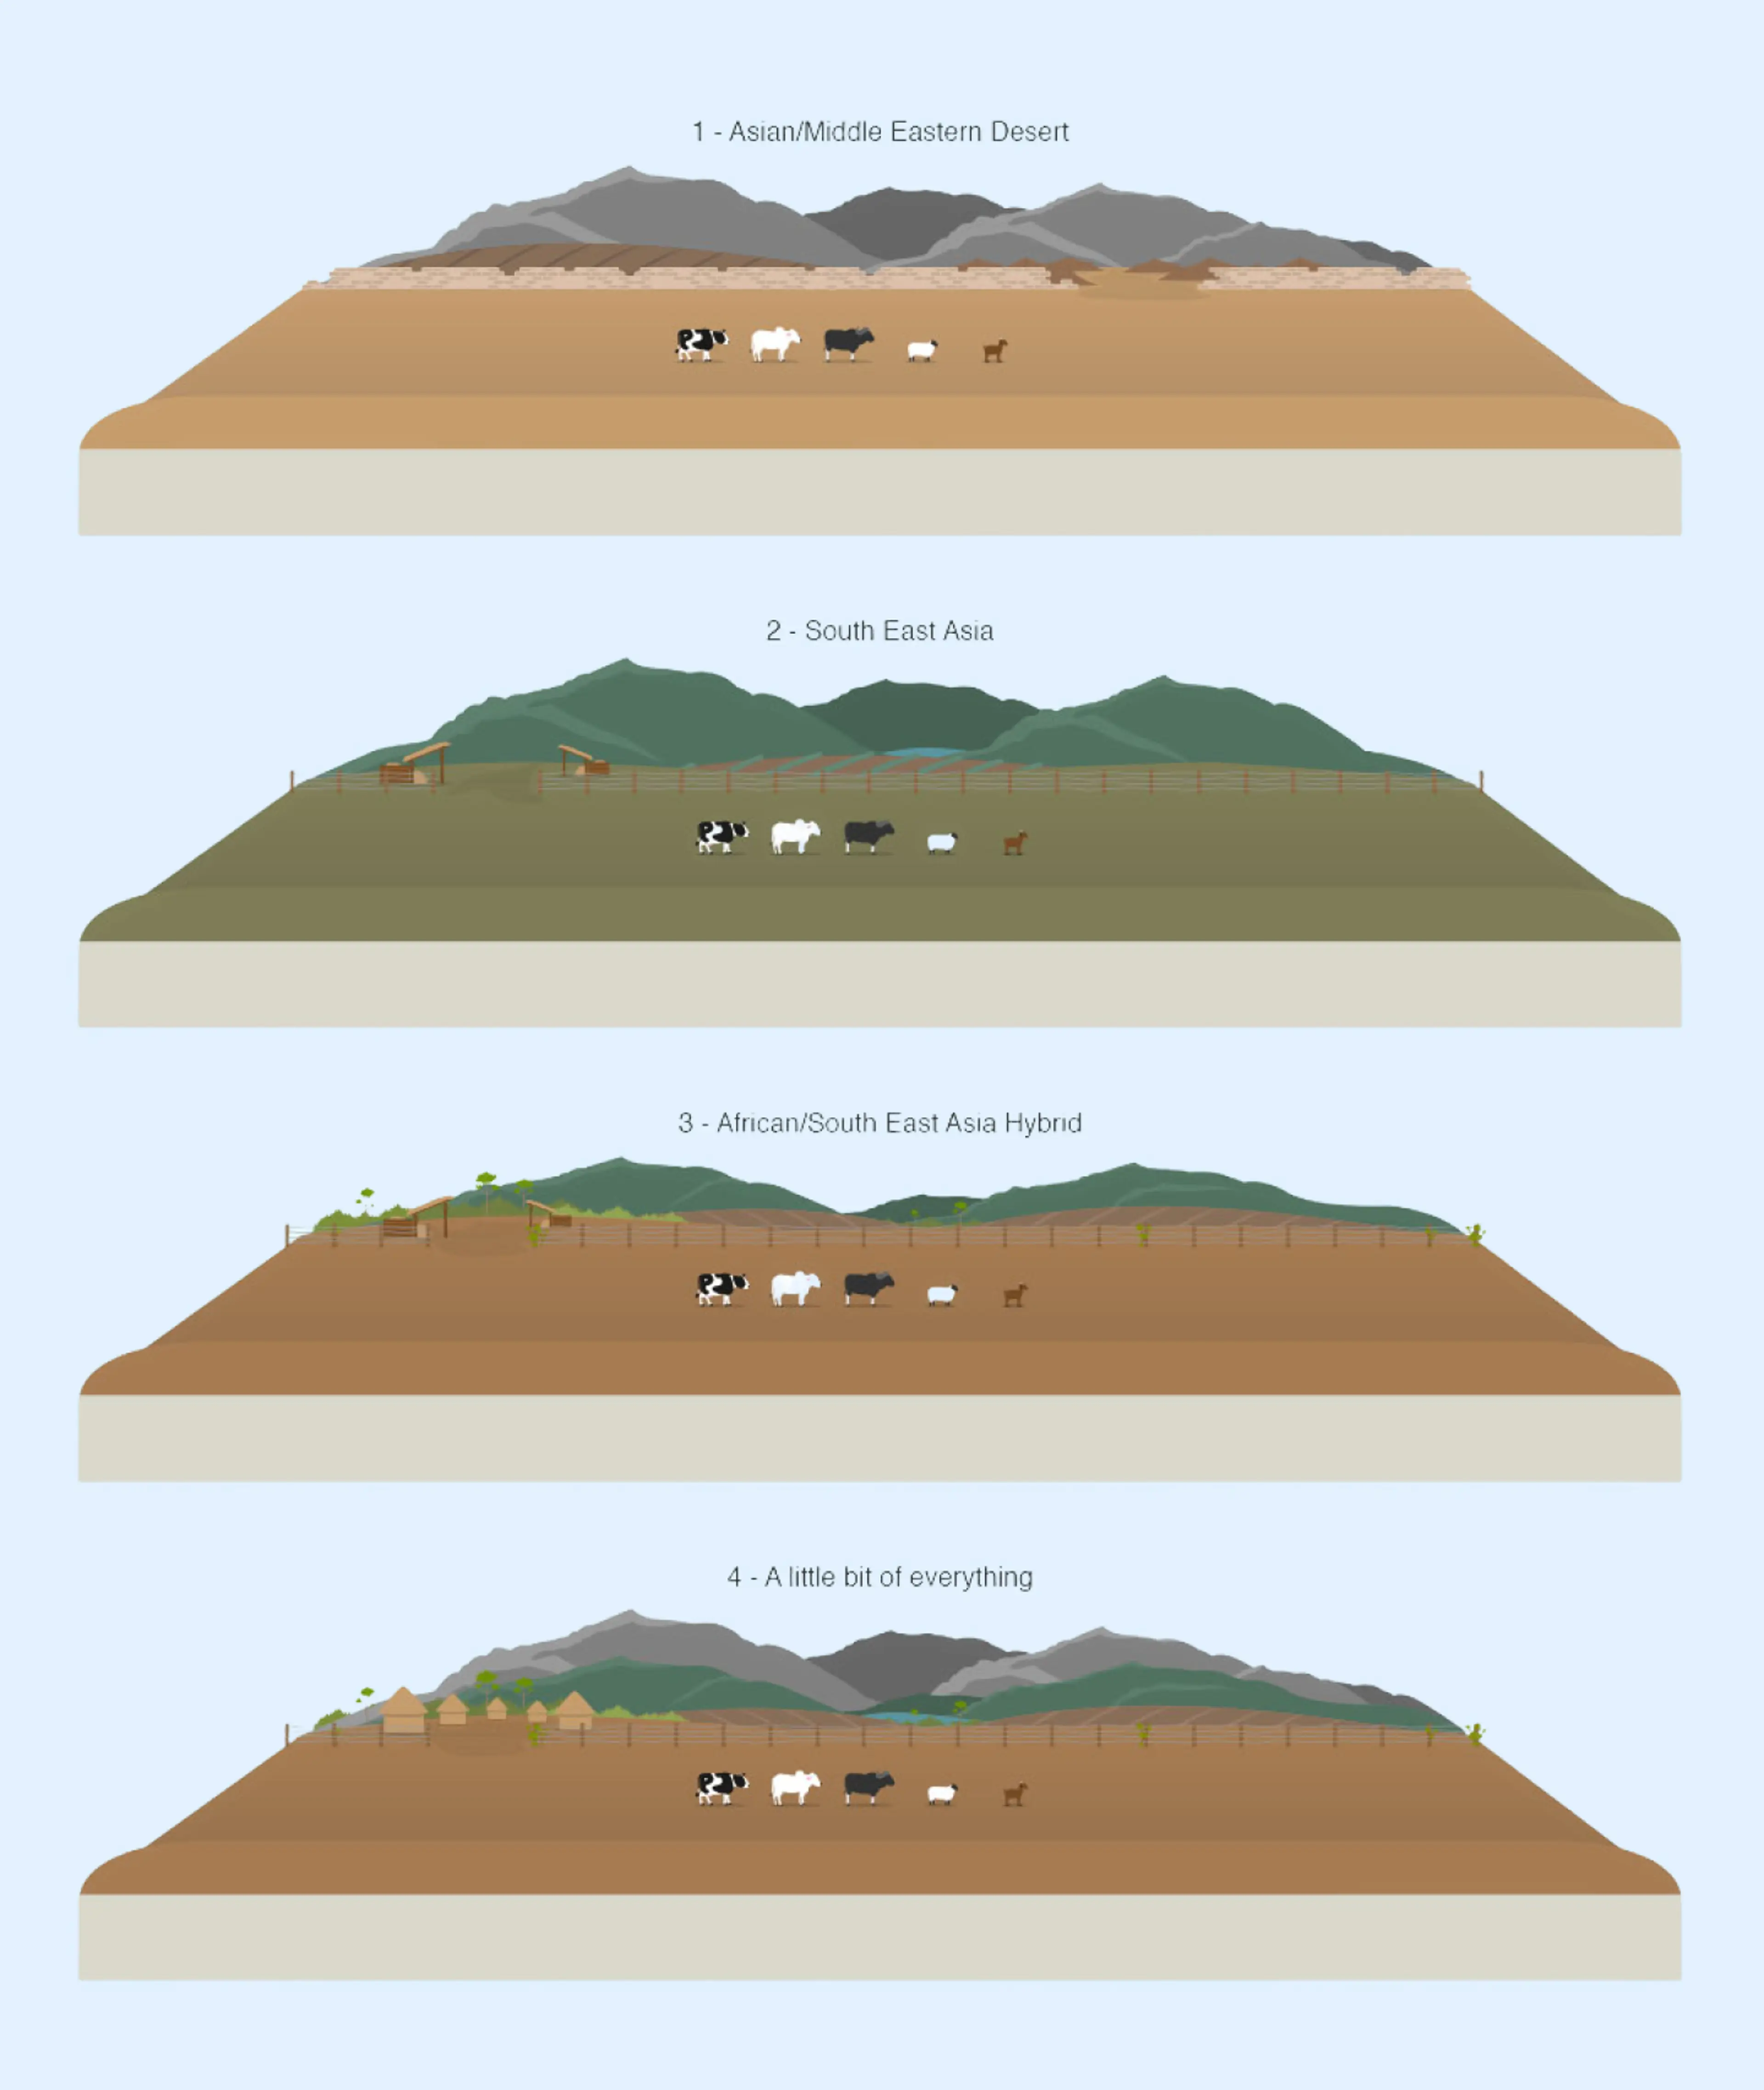
Changing certain inputs produces corresponding changes in the animations. For example in the Disease step, the effect of changing the numbers of infected animals or reducing milk output are visually represented.
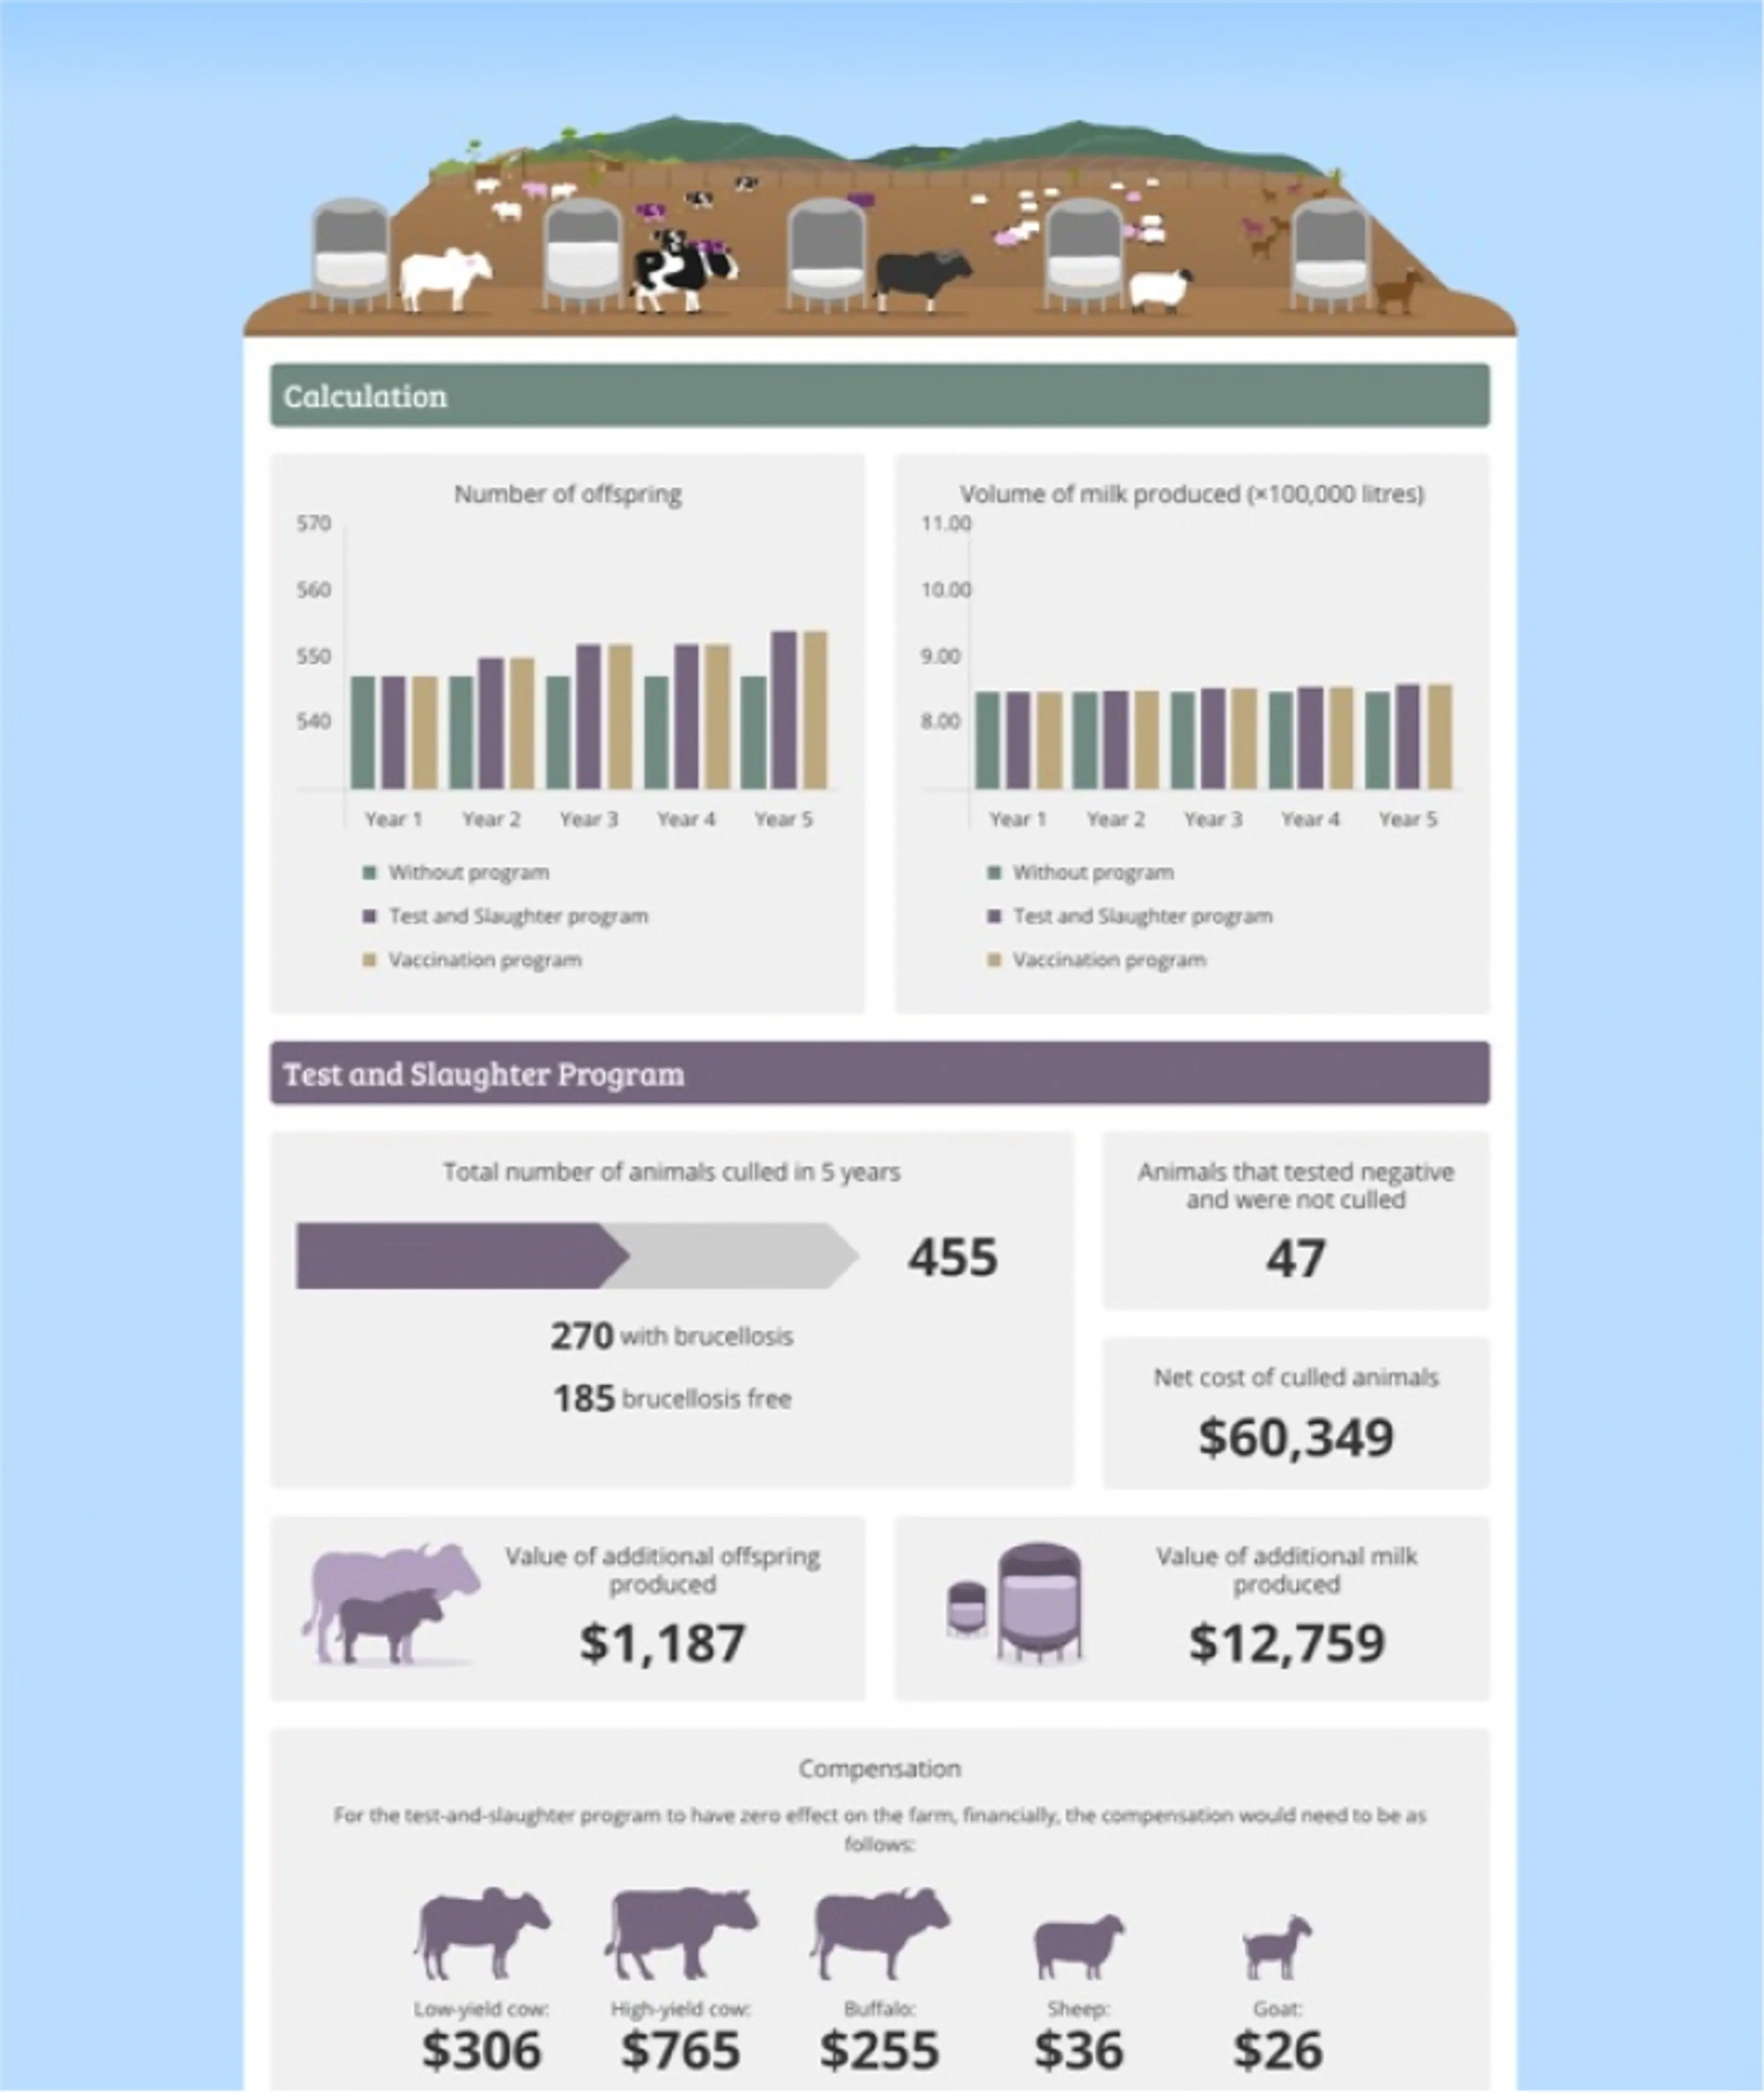
The results of the calculations are displayed as an infographic style presentation with the number of offspring and volume of milk displayed as animated and interactive graphs. The format makes it really clear for anyone to see how much compensation would need to be paid per animal for the disease control programme to have no adverse economic impact on the farm.
The project was delivered as a package of html, javascript, css and image files for deployment on RVC’s own web server and displayed inside a wiki.
More client stories
The University of Oxford
A tool built on machine learning techniques to predict battery lifetimes
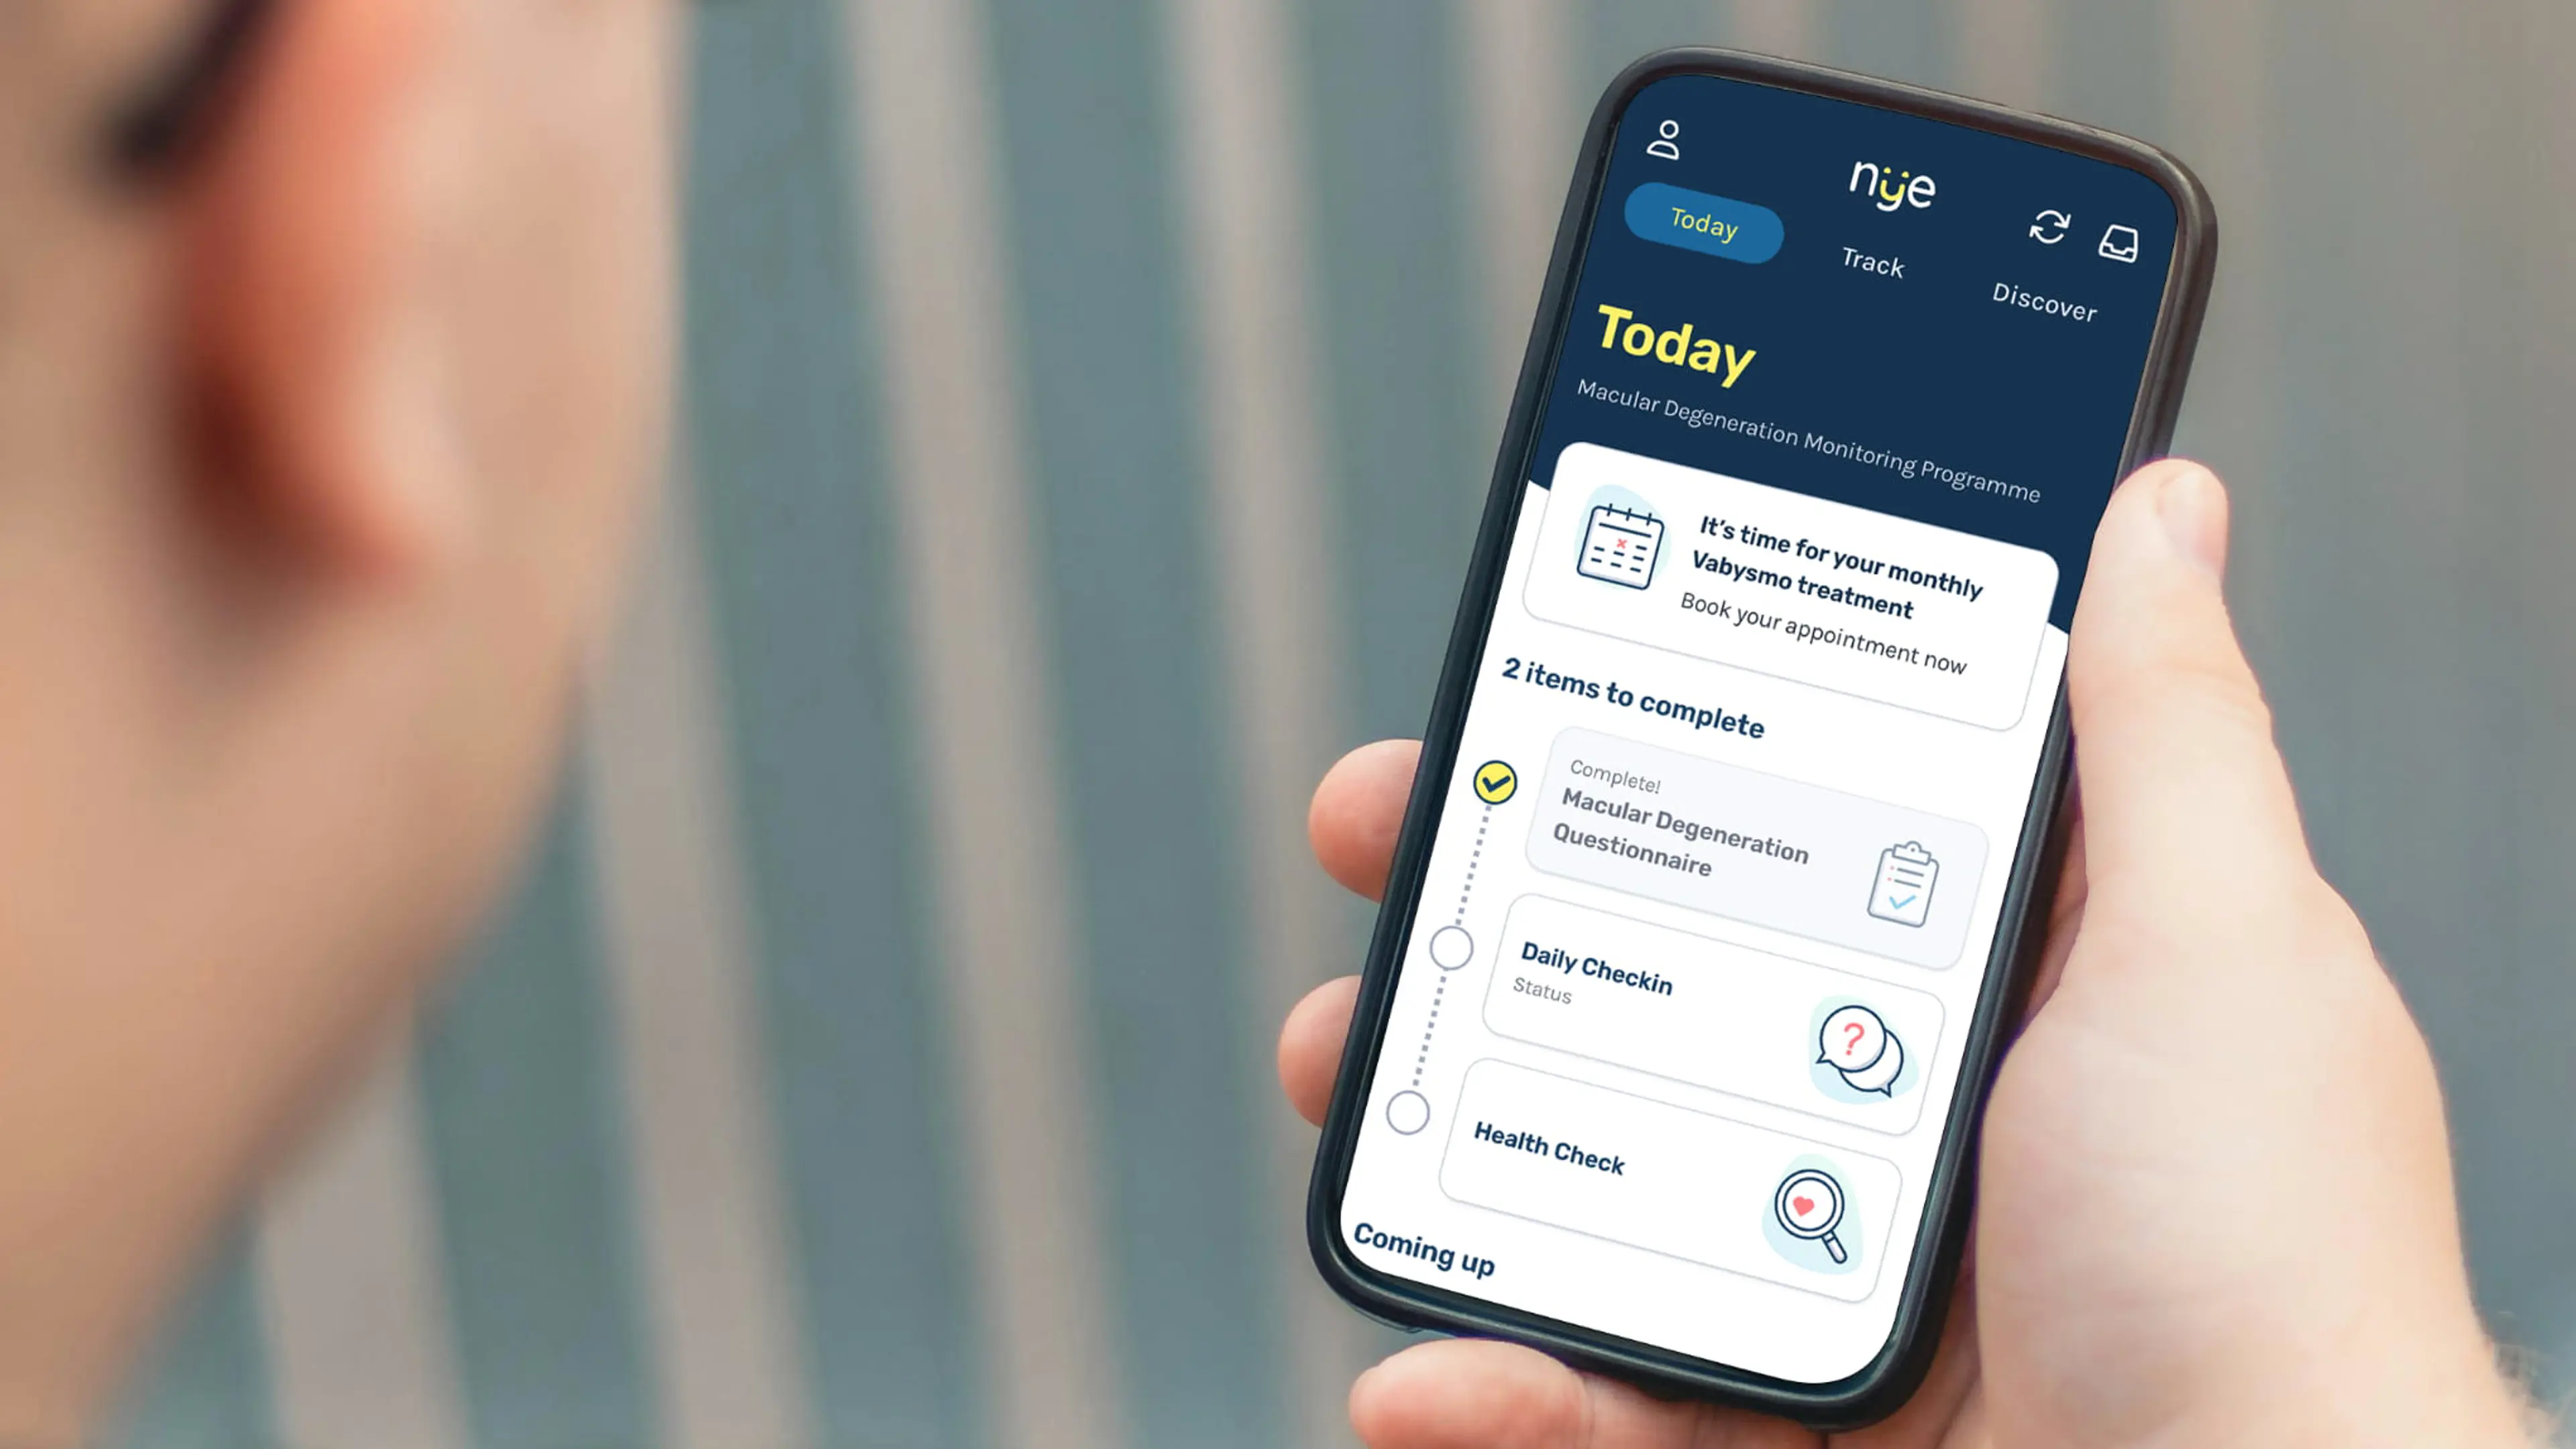
Nye Health
Personalised patient support programme capability for effective healthcare management

Psyomics
A web-based medical device for mental health triage and assessment

Cambridge Institute for Sustainability Leadership
A game for building leadership skills to tackle global climate challenges
Fluent sits within the Cambridge Agency Group, working closely with a wider network of complementary digital specialists. Take a look at more work and case studies from across the group.
More from across the group

Talk to us about empowering the next generation
Got a big idea, want to know how to commercialise it? Let us help you turn that idea into an actionable strategy.