Ito World
Partnering with Ito World to map transit information for governing bodies

Ito World are transit data experts. They solve complex transportation challenges on behalf of bus operators and local authorities. That means working with enormous, intricate sets of real-time transit data.
To present that data in the most useful way possible, they develop a suite of visualisation tools and platforms. Satisfying diverse groups of stakeholders demands a meticulous approach to UX.
Fluent has been Ito World’s development partner since 2018. As part of their wider team, we’ve provided research, design, UX, and front-end engineering expertise on major transit data projects.
Visualising complex datasets with clarity
32,700 buses are on the road in England alone, facilitating 2.8 billion passenger journeys every year. Keeping those services running on time takes vast quantities of high-quality transit data. Ito World’s digital products gather, enhance, and deliver that data to stakeholders like Google, Apple, and the Department for Transport.
In 2018, they were looking for a front-end development partner to back up their mix of in-house expertise. So far, their work had consisted of providing sets of top-quality data. By building customer-facing digital products, they could make that data more widely accessible.
Fluent’s track record in successfully reflecting complex back-end requirements made us the ideal fit for the partnership. Our first project together, a disruption reporting system for Transport for the North, defined the experience we wanted to provide. It also set the scene for future projects, including Ito World’s own internal knowledge management system.
Then, in 2020, we found our biggest collaborative challenge yet. A platform for reporting on the punctuality of every bus in the UK was being overseen by consultancy powerhouse, KPMG. Ito World came in to provide the transit data, with Fluent handling the platform’s front-end UX design and Angular development.
Getting to the route of the problem
The Analyse Bus Open Data (ABOD) project came from new government legislation requiring bus operators to track their vehicles’ performance. As such, the list of stakeholders didn’t end with KPMG. It included the Department for Transport, the Driving Vehicle Standards Authority, the Office for the Transport Commissioner, and multiple local authorities.
It’s impossible to overstate the complexity of tracking every stop made by every bus along every route in the UK. Working with KPMG’s user research team to interview local authorities, we began exploring this gigantic mass of data. A project board containing tens of thousands of post-its helped create a well-received set of prototype wireframes.
Since this was ultimately a government project, we used the GOV.UK Design System (GDS) to develop the final UI. We love design systems, and GOV.UK’s is an incredibly well-developed example. Within that framework, we could build a public-facing app to present the data coming from Ito World’s back-end experts.
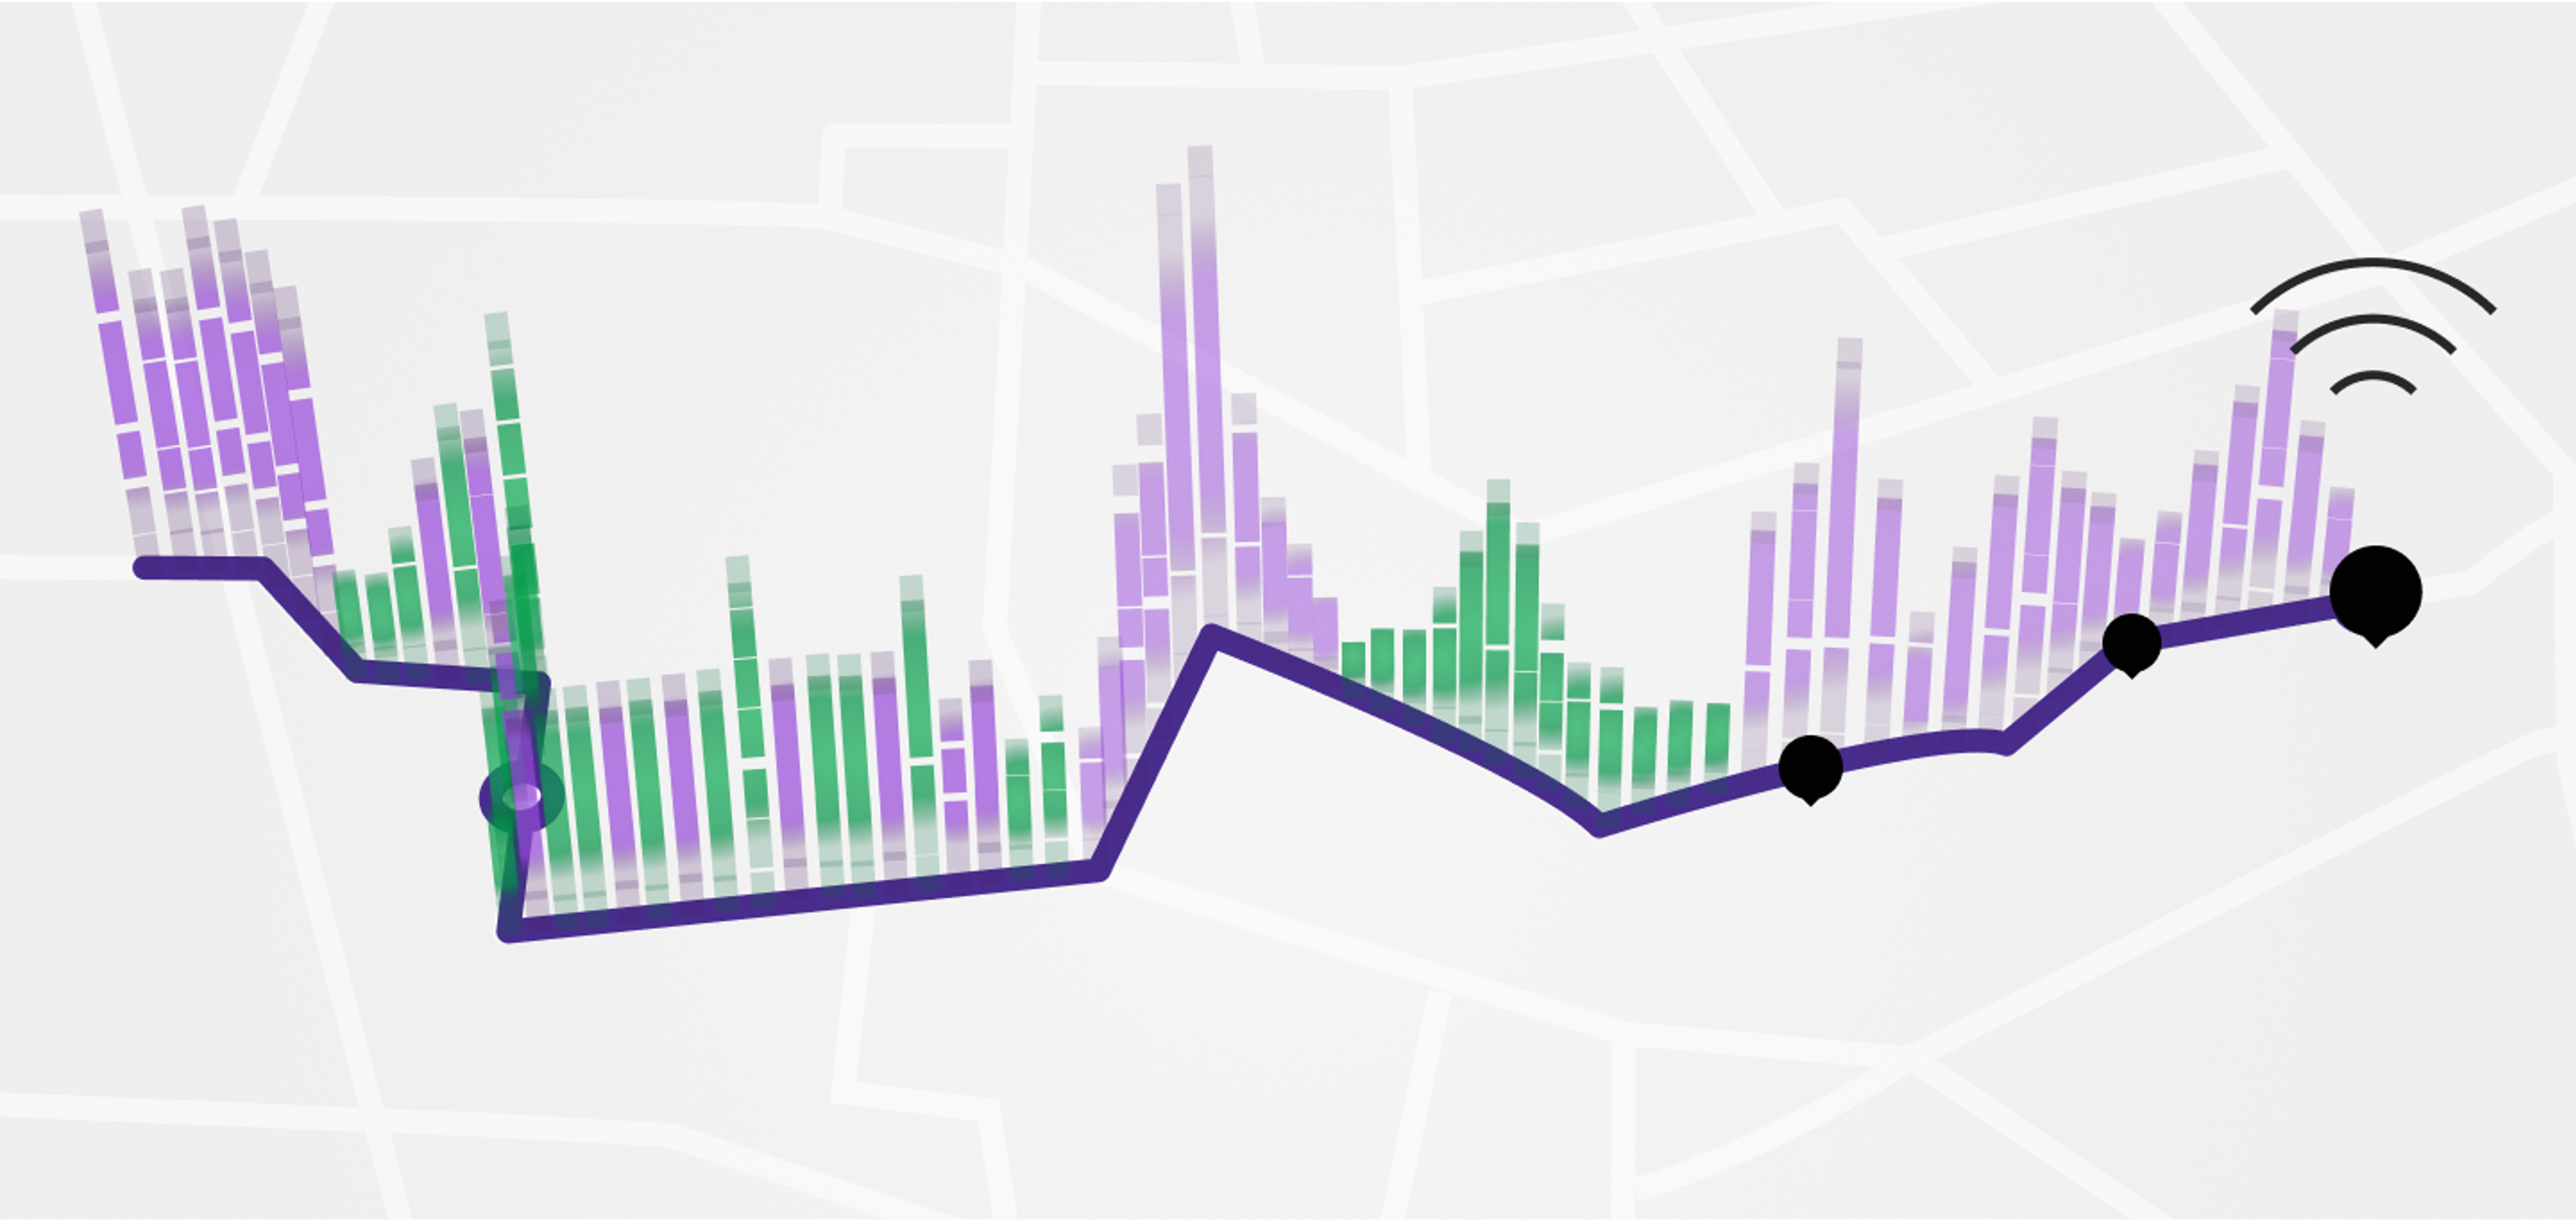
The result was incredibly powerful and versatile. ABOD tracks bus data in real time, letting users fairly compare different bus operators’ performance. They can also zoom in on individual services, seeing when in the day they’re most likely to arrive on time.
Long-term, this lets Ito World use their Integrated Transit Model to predict how buses are likely to perform. In the event of missing, incomplete, or disrupted dataflows, ABOD can still take a solid guess at the real-world situation. From passengers to policymakers, everyone is benefitting from this kind of transparency and accuracy.
Outcome: Data insight driving long-term reform
ABOD launched in December 2020 and continues to support the UK’s National Bus Strategy. UK-wide bus reform is possible thanks to efficiency and accountability-boosting platforms like this. Reform means more bus journeys, fewer cars on the road, with dramatic cuts to congestion and pollution.
All this doesn’t go unnoticed. ABOD won the 2022 Peter Huntley Memorial Bronze Award in the UK Bus Awards. It’s testament to the power of today’s data science to revolutionise the way governments approach transport.
And, of course, it helps to have a streamlined user experience. No matter how complex your next development project might be, Fluent UX design can be the secret to award-winning clarity.
More client stories

Climate Governance Initiative
Mobilising global business leaders through climate education

Cambridge Institute for Sustainability Leadership
A game for building leadership skills to tackle global climate challenges

Young Enterprise: Money Heroes
A financial education platform that guides kids towards better financial literacy
Wind Pioneers
Windfarm design software for renewable energy engineers worldwide
Talk to us about building for the future
Ready to create a better way of working, for people and our planet? Talk to Fluent, sustainability is in our code.